The Bitcoin price started the week very bullish again in order to react to the increase with an even stronger sell-off. Will Bitcoin break out bearish soon?
Bitcoin’s Sideways Movement is Unconvincing
 Bitcoin Price Chart by Tradingview
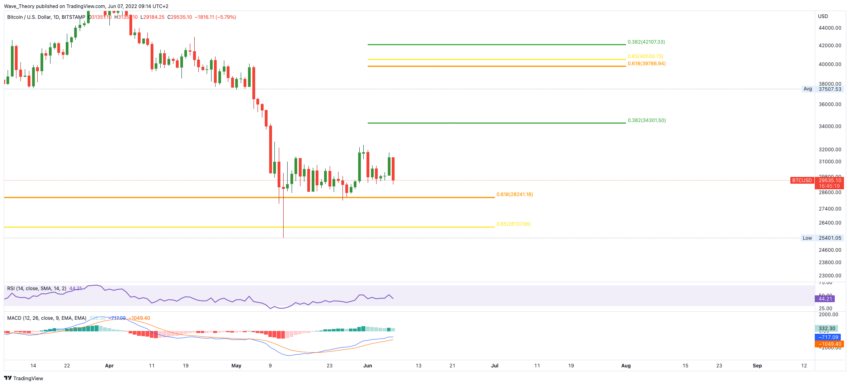
The bullish start of the week yesterday, on which the Bitcoin price rose around 6%, is followed today by an even stronger sell-off, with which BTC has fallen around 8% again. This makes Bitcoin even a lower high point than at the beginning of last week, when Bitcoin made a similarly bullish start to the week, but then ended the week bearish again.
With this sideways movement, Bitcoin convinces the bulls little and the probability that Bitcoin will make a bullish trend change is fading. However, as long as Bitcoin can at least stay above the Golden Ratio support between 26,000 – 29,000 USD, there are still bullish opportunities.
Then Bitcoin could also rise to around 34,000 USD or 40,000 USD, because Bitcoin encounters significant Fibonacci resistance there.
In addition, the MACD lines are still crossed bullish, but the histogram is already ticking bearishly lower today.
Bitcoin price could correct to 14,000 – 20,000 USD
 Bitcoin Price Chart by Tradingview
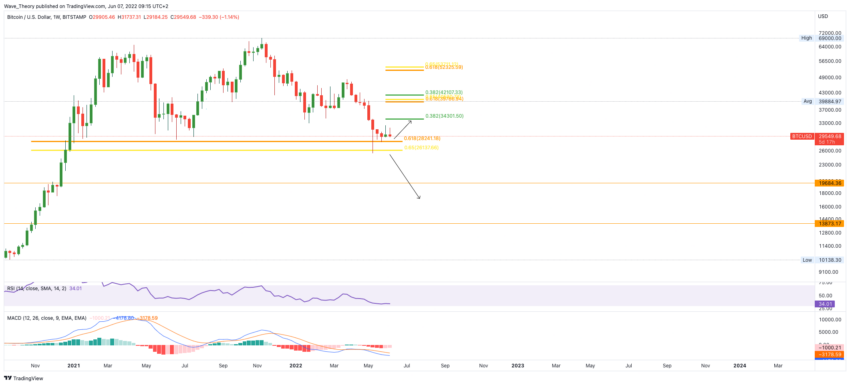
If Bitcoin fails to bounce back from the Golden Ratio support between $ 26,000 – $29,000, it could correct to around $14,000 – $20,000. Because if Bitcoin breaks the golden ratio between $ 26,000 – $ 29,000 bearishly, BTC will only find support again between $ 14,000 – $ 20,000.
On the other hand, if Bitcoin stays above the Golden Ratio support, important golden ratio resistance awaits Bitcoin at around $ 40,000.
If Bitcoin can break this resistance, the decisive resistance awaits Bitcoin at around $ 42,000 and $ 54,000. Because without a break in the golden ratio at around $ 54,000, Bitcoin has no chance of new highs.
Only with the break of the Golden Ratio at around $ 54,000 is Bitcoin in a new bull cycle.
In addition, the MACD is currently giving mixed signals, because the histogram is ticking bullish higher, but the MACD lines remain bearishly crossed.
Bitcoin price may have already found its bottom
 Bitcoin Price Chart by Tradingview
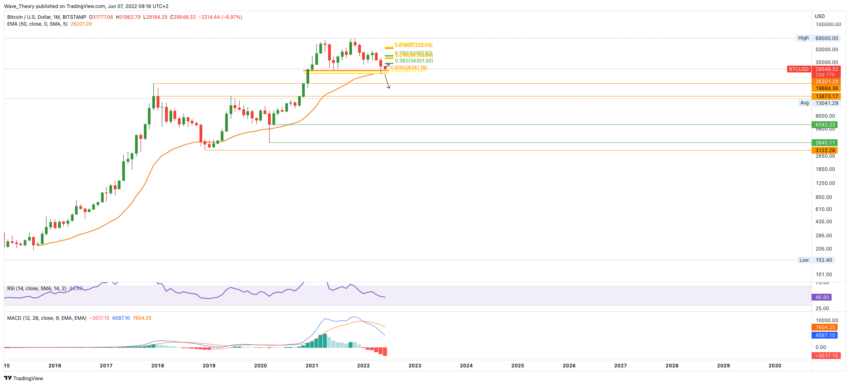
That Bitcoin has not broken the 50-month EMA at the Golden Ratio at around $26,000 bearish so far is a bullish sign. In fact, there is still a chance that Bitcoin has already found its bottom.
However, this probability is currently decreasing, because Bitcoin does not give a sign of a bullish trend reversal, instead it is moving sideways, with a downward trend.
The longer Bitcoin stays at the Golden Ratio support, the lower the chance of a bullish bounce, but the higher the chance of a bearish breakout.
So if Bitcoin does not initiate an upward movement towards $ 34,000 or $ 40,000 soon, the chance of a decline to $ 14,000 – $ 20,000 increases.
In addition, the MACD is still clearly bearish on the monthly chart, because the histogram is ticking bearishly lower and the MACD lines remain crossed bearishly.
Bitcoin Dominance Continues to Rise
 Bitcoin Dominance Chart by Tradingview
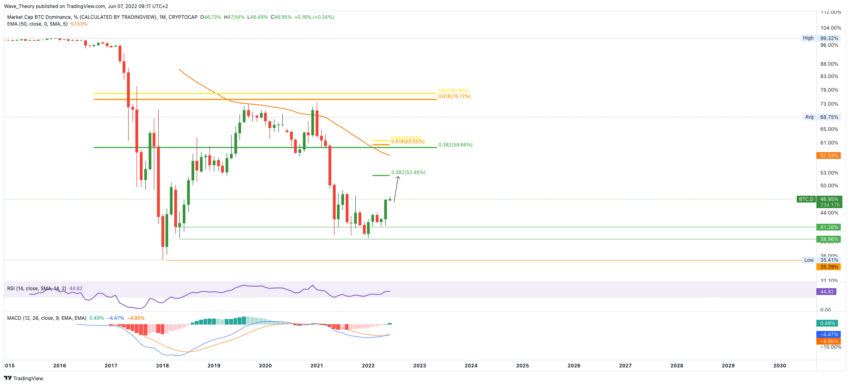
The Bitcoin dominance continues to rise and the monthly MACD is clearly bullish. The histogram is ticking bullish higher and the MACD lines are crossed bullish. The market share of Bitcoin could now rise to around 52% or even 60%.
Towards the bottom, between 39 – 41% significant support awaits Bitcoin’s market share.
Disclaimer
All information contained on our website is researched to the best of our knowledge and belief. The journalistic articles are for general information purposes only. Any action taken by the reader on the basis of the information found on our website is done exclusively at his own risk.


