The IOTA price shows a bullish divergence in the daily chart and has chances for a bullish candle formation in the BTC monthly chart.
Massive Bullish Divergence Boosts IOTA Price
 IOTA Price Chart by Tradingview
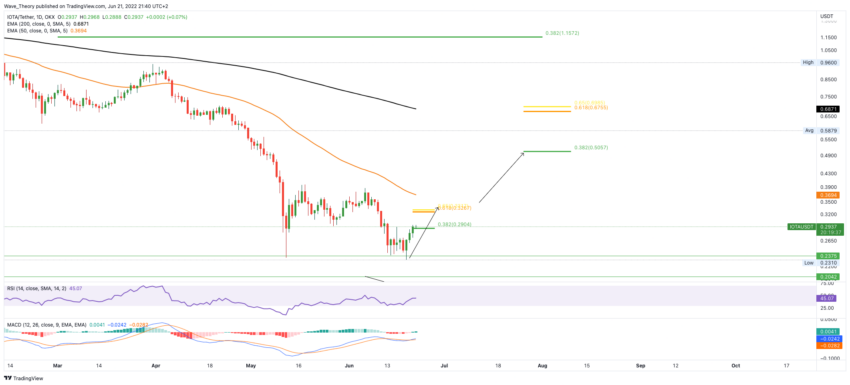
The daily chart shows a massive bullish divergence in the RSI and histogram of the MACD, after which the IOTA price was already able to rise by about 29%. Now the IOTA price is encountering resistance at the 0.382 Fib level at around 0.29 USD. If IOTA breaks this resistance, IOTA could rise to the golden Ratio at around $ 0.33.
However, the EMAs are still in a death cross, which means that the trend remains bearish in the short to medium term. In contrast, the MACD’s histogram ticks bullish higher and the MACD lines are crossed bullish.
In the short term, there are bullish prospects for IOTA.
The IOTA rate could rise to 0.7 USD
 IOTA Price Chart by Tradingview
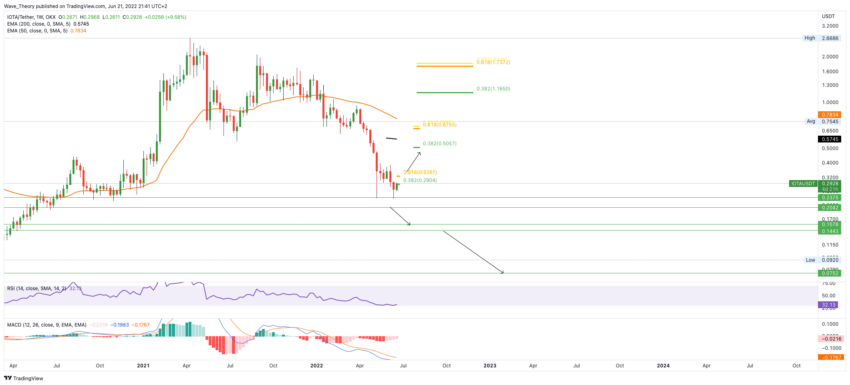
Towards the bottom, significant support is waiting for the IOTA price between 0.2 – 0.24 USD. If this support is broken bearishly, IOTA will find significant support between 0.14 – 0.16 USD at the latest.
However, the MACD’s histogram is also ticking bullish higher on the weekly chart. If IOTA breaks both Fibonacci resistances at $0.29 and $0.33, IOTA could even rise to the next Fibonacci resistance at around $0.5. If IOTA also breaks this resistance, the next Fibonacci resistance is waiting at around $ 0.7.
Despite the short-term bullish outlook, the MACD lines are still bearishly crossed. The trend of IOTA remains bearishly intact until IOTA breaks the Golden Ratio at around $1.8.
So a bullish trend reversal is still a long way off.
In the monthly chart, the IOTA price is still bearish
 IOTA Price Chart by Tradingview
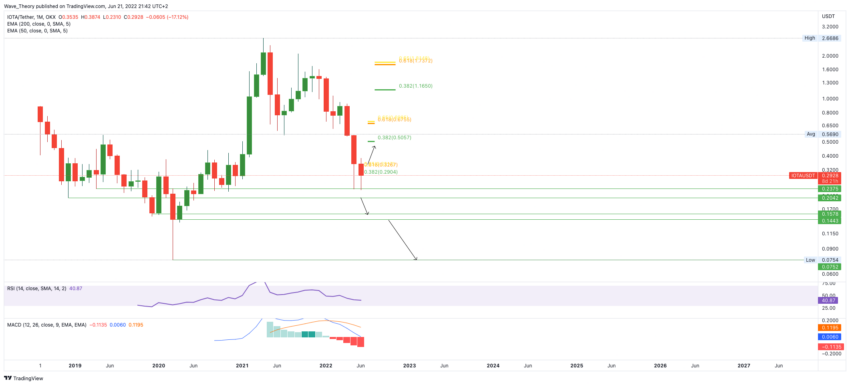
This is particularly evident in the monthly chart, which does not give any bullish signals. In the monthly chart, the MACD lines are also crossed bearishly, but the histogram also ticks bearishly lower. The RSI is neutral and the monthly candle is very likely to close bearishly with regard to the little time remaining.
Against BTC, there could be a bullish candlestick formation in the monthly chart
 IOTA Price Chart by Tradingview
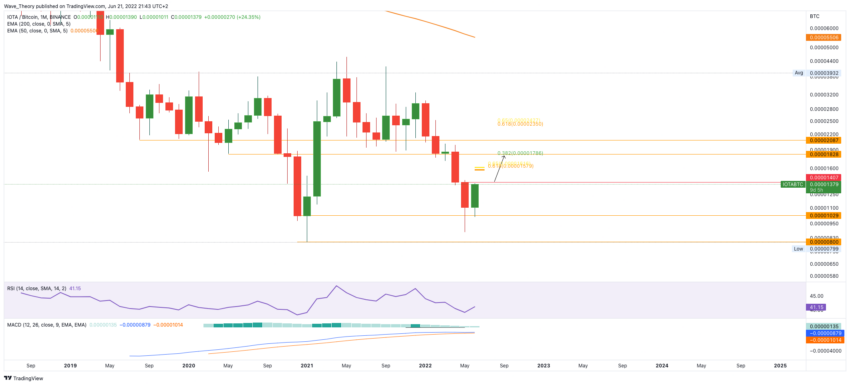
In contrast, IOTA is extremely bullish against BTC on the monthly chart, because here the monthly candle could form a “bullish engulfing candle”; a bullish candle formation. For this, the IOTA rate would have to be above 0.00001407 BTC on the first of the new month. Then IOTA could rise to the 0.382 Fib level in the new month at around 0.0000179 BTC.
In addition, the MACD’s histogram is also ticking bullish higher and the MACD lines are crossed bullish.
Towards the bottom, significant support is waiting for IOTA between 0.000008 – 0.0000103 BTC.
Disclaimer
All information contained on our website is researched to the best of our knowledge and belief. The journalistic articles are for general information purposes only. Any action taken by the reader on the basis of the information found on our website is done exclusively at his own risk.
