The NVIDIA share reached the support at around 140 USD and bounced back very strongly. Is the NVDA price now rising to around 200 USD?
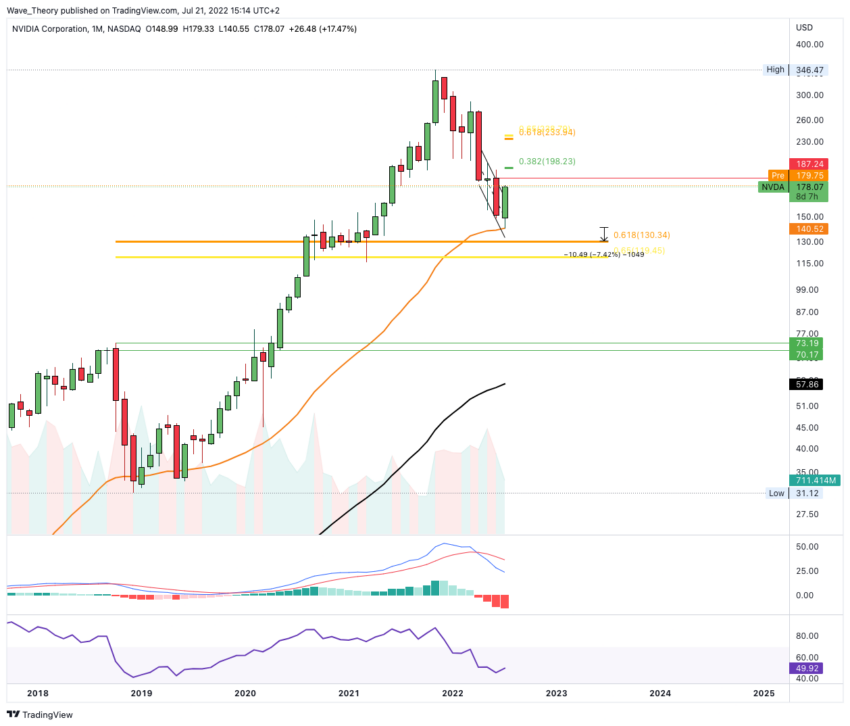
“The NVIDIA share is very bearish and continues the downward trend. Between 120 – 140 USD there is significant support waiting for the NVIDIA course, because there NVIDIA comes across Golden Ratio support and the 50-Month EMA. At this price level, the NVIDIA share could bounce very strongly to rise to 150 – 180 USD. In addition, NVIDIA bounced very strongly at the 50-month EMA in 2018 and 2019 and NVIDIA shares have never been below the 50-month EMA since.“
NVIDIA stock bounces off 50-month EMA
 NVDA Price Chart from Tradingview
The NVIDIA share corrected to the 50-month EMA at around 140 USD and bounced back very strongly. Thus, NVIDIA has already reached the upper range of our price target at around 180 USD. Nevertheless, the NVIDIA share could now rise even higher.
In any case, the Golden Ratio support between 120 and 130 USD remains unaffected, because the NVDA rate still had to fall about 7.5% below the 50-month EMA. Whether NVIDIA will still achieve the Golden Ratio in the medium term depends largely on whether NVIDIA manages to form a bullish candlestick formation this month. For this, the price would have to be above 187.24 USD at the end of the month.
If there is a bullish candlestick formation on the monthly chart, the bullish price target would be at round 235 USD. NVIDIA encounters significant Fibonacci resistance there.
But apart from the bullish chances, there is still the chance that NVIDIA will correct the golden ratio at around 120 to 130 USD. After all, the MACD is still clearly bearish on the monthly chart. Finally, the histogram is ticking bearishly lower and the MACD lines remain bearishly crossed, while the RSI is neutral.
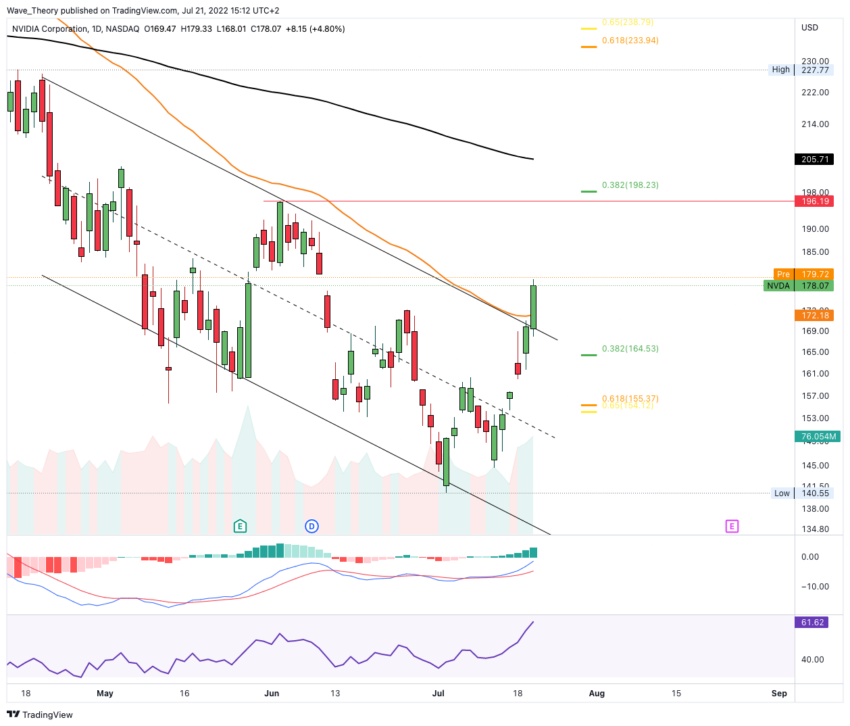
NVIDIA stock breaks 50-day EMA bullish
 NVDA Price Chart from Tradingview
The NVIDIA price was not only able to break the 50-day EMA bullish at around $ 172, but also breaks out of the parallel downward channel bullish. In addition, the MACD is clearly bullish on the daily chart, because the histogram is gradually ticking bullish higher while the MACD lines remain crossed bullish.
The NVIDIA price could now rise to the horizontal resistance at around 196 USD, or even to the 0.382 Fib level at around 198 USD.
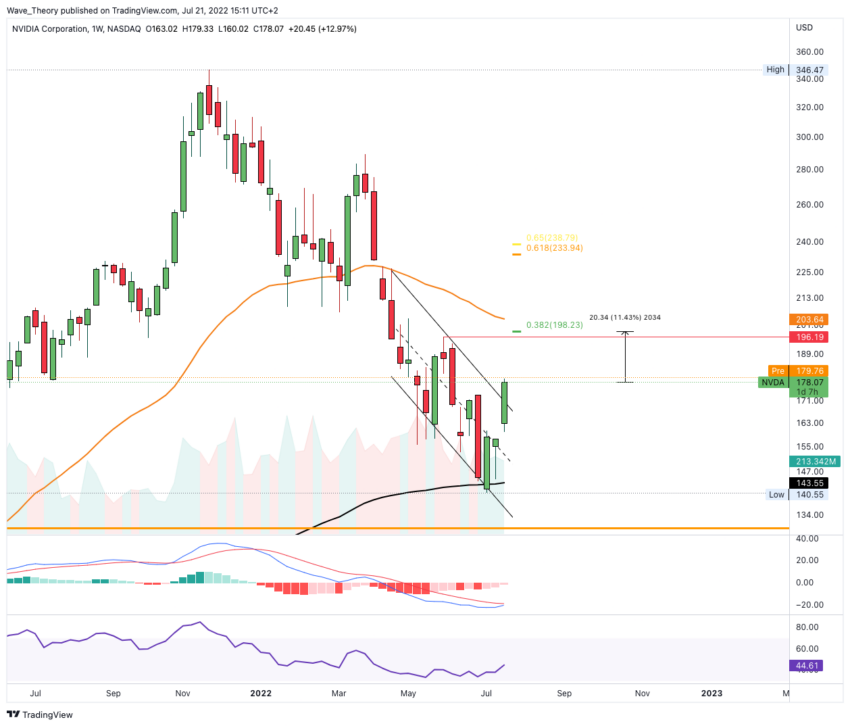
NVDA price encounters resistance between 196 and 204 USD
 NVDA Price Chart from Tradingview
In addition, the histogram of the MACD in the weekly chart is also ticking bullish higher and the MACD lines are about to cross bullish. If the NVDA price continues the upward movement, it expects significant resistance between 196 and 204 USD at the latest. At around $ 204, the 50-week EMA is waiting for NVIDIA, which NVIDIA may encounter bearish rejection.


