The Pi Cycle Bottom indicator provided a buy signal. The still quite new indicator should be suitable for determining the next macro floor of the BTC price. Are we nearing the end of the Bitcoin bear market?
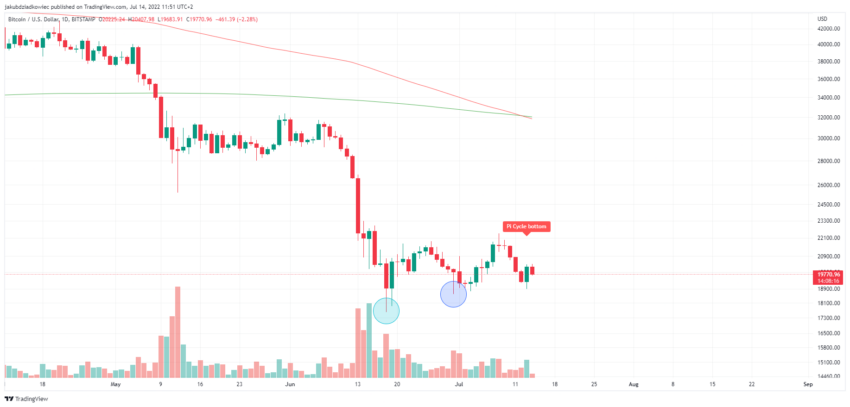
At the end of June, we wrote in one of our Bitcoin analyses that the next buy signal of the Pi Cycle Bottom indicator will probably appear on July 9, 2022. On July 13, 2022, when the Bitcoin price fell to 18,900 US dollars, it was then time.
On June 18, 2022, the Bitcoin price reached the last low of the year at $ 17,622 (blue circle). After that, the BTC price fell to the next, higher low at $ 18,600 on June 30, 2022 (dark blue circle). So, the buy signal of the indicator appeared at the moment when the BTC price formed the third higher low.
 BTC/USD Daily Chart Source: Tradingview
How has the Pi Cycle Bottom Indicator performed in the past?
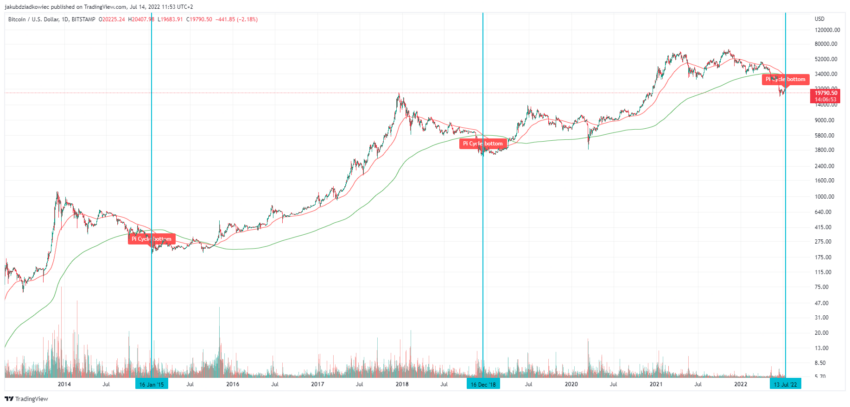
The Pi Cycle Bottom Indicator is a simple indicator based on two long-term moving averages: the 471-day SMA and the 150-day EMA. If the 150-day EMA falls below the 471-day SMA, then the indicator gives the buy signal.
In the past, the indicator provided three signals so far (the blue lines). On January 16, 2022, this was the case for the first time. Two days earlier, the Bitcoin price reached the macro bottom of the then cycle at 152 US dollars.
On December 16, 2022, just one day after the BTC price fell to the bottom of the previous bear market ($ 3,122), the indicator issued the second buy signal.
 BTC/USD Daily Chart Source: Tradingview
If the Bitcoin price really reached the last bottom on June 18, 2022, then the time interval between the buy signal and the bottom with 25 days is significantly greater this time.
However, it could also be that we will see a strong downward movement or a last capitulation dump in the next 2 or 3 days before the BTC price reaches the bottom. In this case, the indicator would have “predicted” the bottom almost as accurately as in the previous cycles.
Bullish Bitcoin Interpretations
Despite the possible inaccuracies and just two data points of the Pi Cycle Bottom indicator, many analysts presented bullish interpretations for the buy signal. So, the trader @rovercrc compared three Bitcoin charts, on which the signal lit up, with each other and came to the conclusion that the Bitcoin price is just forming the bottom.
The analyst @el_crypto_prof published a Bitcoin monthly chart on which he drew three support lines. In his opinion, the BTC price has already completed an A-B-C correction structure and has already reached the bottom.
$BTC #Bitcoin
The Pi-Cycle-Bottom indicator has just marked a possible bottom for $BTC.
-This is the third time in the history of #Bitcoin.
-In 2015 and 2018, this indicator was on point.
It happened, as it does now, after an ABC correction. pic.twitter.com/iCG3kFoH9S— 𝕄𝕠𝕦𝕤𝕥𝕒𝕔ⓗ𝕖 🧲 (@ el_crypto_prof) July 13, 2022
According to his forecast, we will experience a consolidation phase in the coming months, which will then be followed by another bull market.
Trader @Kwontik combined two versions of the indicator, namely the Pi Cycle Bottom and the Pi Cycle Top indicator. The latter can be used for determining the macro maximum levels. In addition, he used a logarithmic chart and drew a support line. In his opinion, this support line will not be broken.
However, this support line does not intersect with the points provided by the Pi Cycle Bottom indicator. He plotted these on the lows that followed the absolute lows of the previous bear markets.


