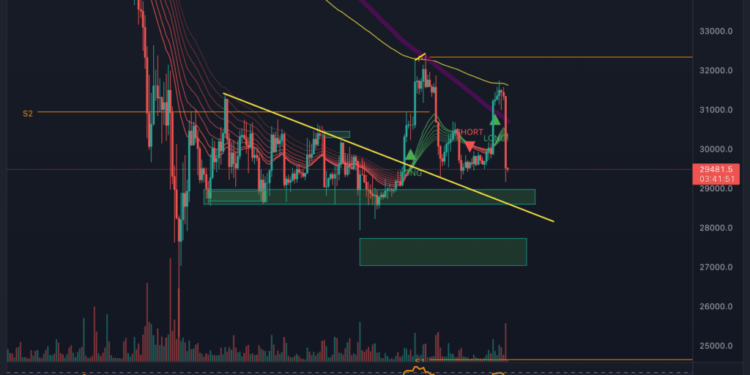
Ethereum continues to show its weaker side. Although we could also see an impulse here, we were rejected hard here at the 200 SMA (last 200 average prices /purple) on the 4H chart.
At the moment we are trading at about 1,750 USD and thus continue in a downtrend. We are now entering an important support area up to about 1,650 USD. If this one breaks, we will see another strong sell-off.
In the short term, we can see at least a small recovery up to about $ 1,840 to fill the inefficiency to the top. In the RSI we have developed a bullish divergence, which can give us an additional boost.
Click here for the latest Tron and Ripple chart analysis.
For a technical analysis of Bitcoin, Ethereum, XRP, WAVES, other altcoins and current news / events, the author has created this video:


