Despite the fact that the crypto market is in a bear market, the Cardano price remains above the last low and breaks out bullish.
Cardano remains above low point at around $0.4
 Cardano Price Chart by Tradingview
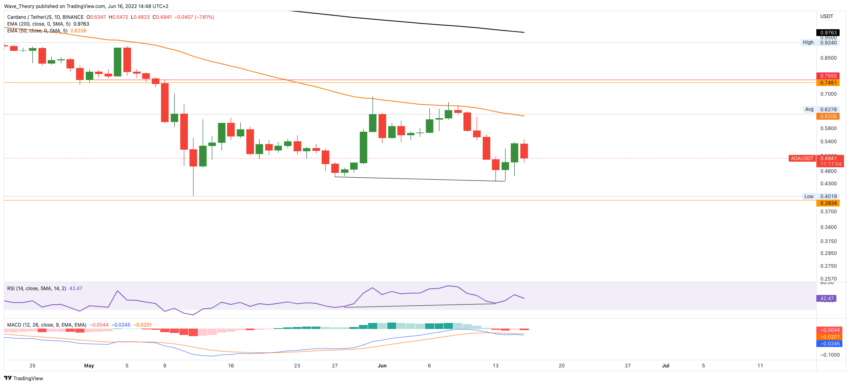
Despite the fact that Ethereum, Bitcoin and the total market capitalization of the crypto market have fallen one floor lower, the Cardano price still remains above the last support at around $ 0.4. In fact, the daily chart even shows a slight bullish divergence in the RSI.
But the ADA price has already reacted to this, because Cardano has risen about 25% in the last two days. Previously, Cardano was twice rejected on the 50-day EMA at around $ 0.62, which still needs to be broken if Cardano wants to have chances for a bullish trend change.
In contrast to the bullish RSI, the MACD is still bearish, because the histogram is ticking bearishly lower and the MACD lines are crossed bearishly.
Bullish signal: massive bullish divergence in the weekly chart
 Cardano Price Chart by Tradingview
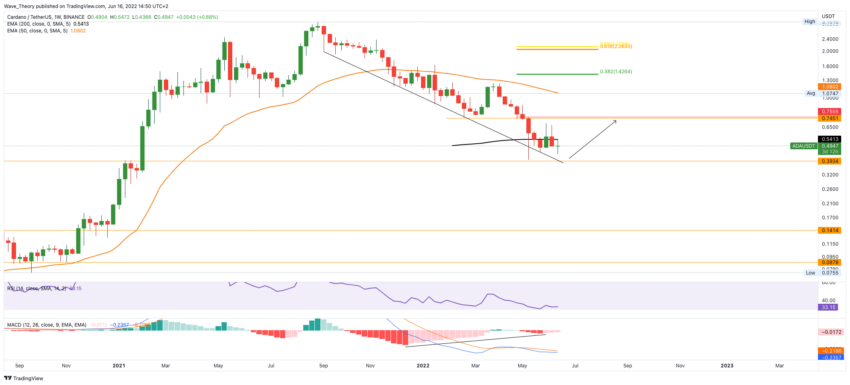
The histogram of the MACD has a massive bullish divergence on the weekly chart. If Cardano stays above the last low point at around $ 0.4, it could soon rise towards the horizontal resistance at around $ 0.74.
However, Cardano only encounters the decisive Fibonacci resistances at around 1.4 USD and 2.2 USD. Without the break of the golden Ratio at around 2.2 USD, the Cardano price remains in the bear trend.
Cardano price finds support between 0.34 – 0.4 USD
 Cardano Price Chart by Tradingview
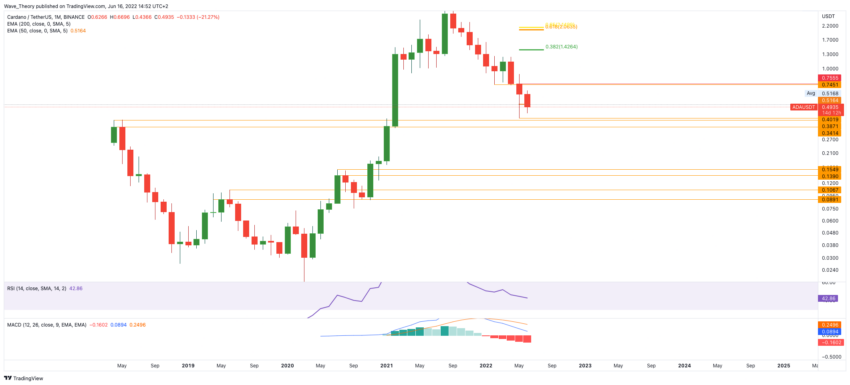
Cardano does not necessarily have to fall low, provided that the ADA price falls below the last low at around $ 0.4. Finally, between 0.34 – 0.4 USD significant support is waiting for the ADA price.
Only if Cardano breaks this support bearishly, Cardano could fall to around $0.14 – $0.16. It is there that Cardano encounters the next significant support.
If Cardano also breaks this support bearishly, significant support is waiting for Cardano between 0.09 – 0.1 USD at the latest.
Cardano price breaks out bullish against BTC
 Cardano Price Chart by Tradingview
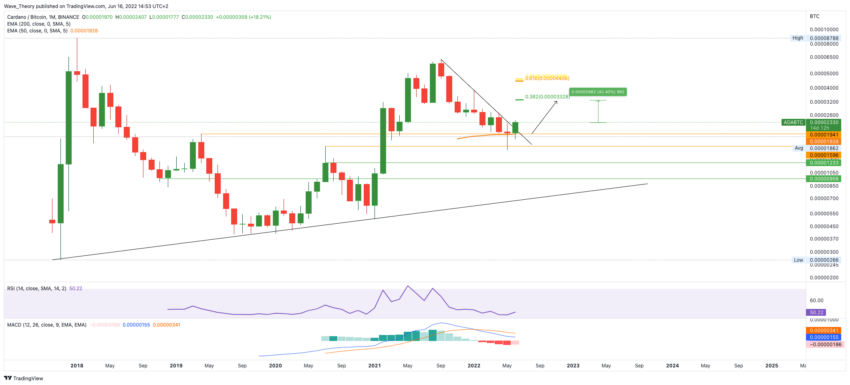
Against BTC, Cardano was now able to break the trend line that had connected the high points since August 2021. This means that Cardano can now rise to the 0.382 Fib level at around 0.0000333 BTC. This implies an upside potential of around 42%.
If Cardano breaks this resistance, it could even rise to the golden ratio at around 0.0000445 BTC. If Cardano overcomes the Golden ratio, the Cardano price against BTC is again in the bull trend.
However, the MACD lines are still bearishly crossed on the monthly chart, but the histogram is ticking bullish higher this month. Towards the bottom, significant support is already waiting for the ADA price between 0.000016 – 0.0000194 BTC. So far, the 50-month EMA has been able to successfully hold at around 0.0000194 BTC, which is also a bullish sign.
Cardano is currently much more bullish than Bitcoin.
Disclaimer
All information contained on our website is researched to the best of our knowledge and belief. The journalistic articles are for general information purposes only. Any action taken by the reader on the basis of the information found on our website is done exclusively at his own risk.


