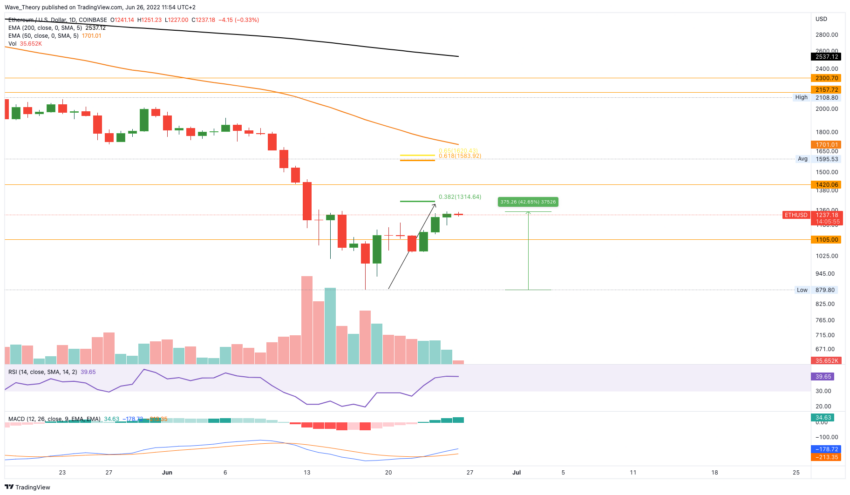
The Ethereum price was able to rise over 42% in the last two weeks and reached $ 1,257. Is the ETH rate still reaching the Fib level at $1,315?
Ethereum price rises above 42% and begins to weaken
 Ethereum Price Chart by Tradingview
The Ethereum price has been able to rise above 42% over the past two weeks. Nevertheless, the Ethereum price is starting to weaken today. Ethereum is still encountering significant resistance at the 0.382 Fib level at around $1,300. However, the ETH price has not yet reached resistance.
On the daily chart, however, the MACD remains strongly bullish. Thus, the MACD lines are crossed bullish and the histogram also ticks bullish higher.
Ethereum Price could Rise to $1,600
 Ethereum Price Chart by Tradingview
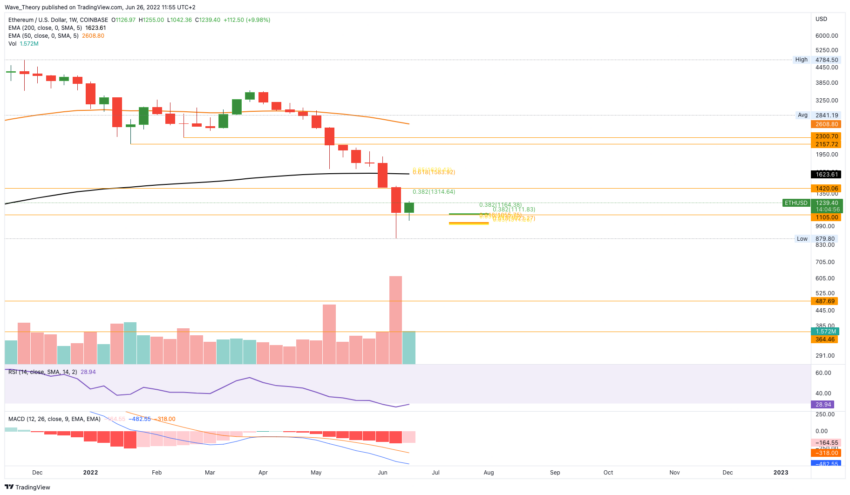
The histogram also ticks bullish higher on the weekly chart; however, the MACD lines remain bearishly crossed. Ethereum could rise to around $1,600 if Ethereum breaks the Fib resistance at around $1,300. At $1,600, Ethereum encounters Golden Ratio resistance and the 200-week EMA.
However, the ETH price is far from a bullish candlestick formation on the weekly chart. For this, Ethereum would have to close above $ 1,433 and there are only a few hours left for Ethereum. For this, Ethereum would still have to rise above 15% today.
If Ethereum corrects now, it will find significant fib supports at around $ 1,111 and $ 1,000. However, if ETH is rejected bearishly at the 0.382 Fib level at $1,315, significant Fibonacci supports are waiting for Ethereum at around $1,150 and $1,050.
Overall, Ethereum still has a good chance of reaching the Fib resistances at around 1,300 USD or 1,600 USD in the medium term, before Ethereum could initiate a correction.
Will the Ethereum price be able to break the 50-month EMA?
 Ethereum Price Chart by Tradingview
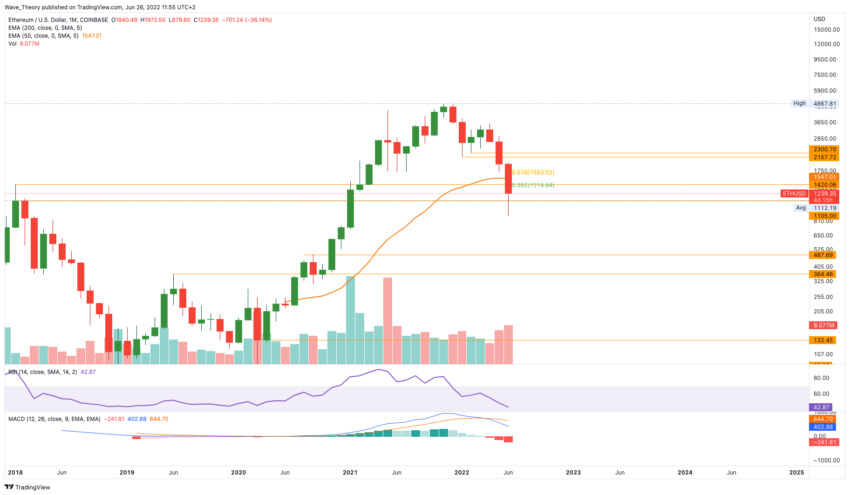
In the monthly chart, the MACD is still clearly bearish, because the histogram ticks bearishly lower and the MACD lines remain bearishly crossed. The RSI gives neither bullish nor bearish signals.
If Ethereum breaks the Fib resistance at around $ 1,300, the 50-month EMA at $ 1,420 is still waiting for the ETH price, which also acts as resistance, before ETH could rise to around $ 1,600.
Against BTC, the ETH price bounces on the 50-month EMA
 Ethereum Price Chart by Tradingview
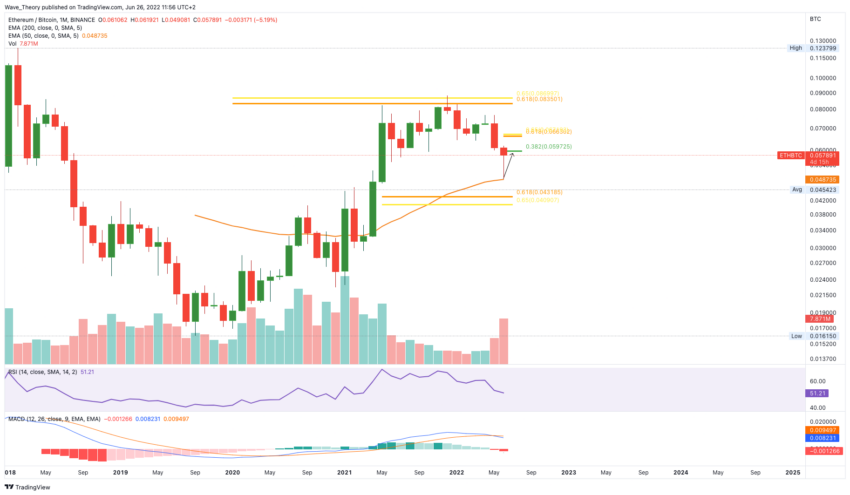
Against BTC, the MACD is also clearly bearish, because the histogram is ticking bearishly lower and the MACD lines remain crossed bearishly. Nevertheless, the ETH price could now bounce very strongly at the 50-month EMA at around 0.049 BTC. This is also where the 200-week EMA is located. We wrote about this two weeks ago:
“Against BTC, the Ethereum price is currently bouncing at the 200-week EMA at around 0.049 BTC. If this support is successful, the Ethereum price could even rise to around 0.06 BTC. Ethereum then encounters significant Fibonacci resistance there.“
If Ethereum breaks the Fib resistance at around 0.06 BTC, the next significant resistance is waiting for Ethereum between 0.065 – 0.067 BTC. If Ethereum is rejected at the 0.382 Fib level at around 0.06 BTC, Ethereum will already find significant Fib supports at 0.055 BTC and 0.053 BTC.
Otherwise, at around 0.04 BTC, the next big Fibonacci support is waiting for the ETH course.


