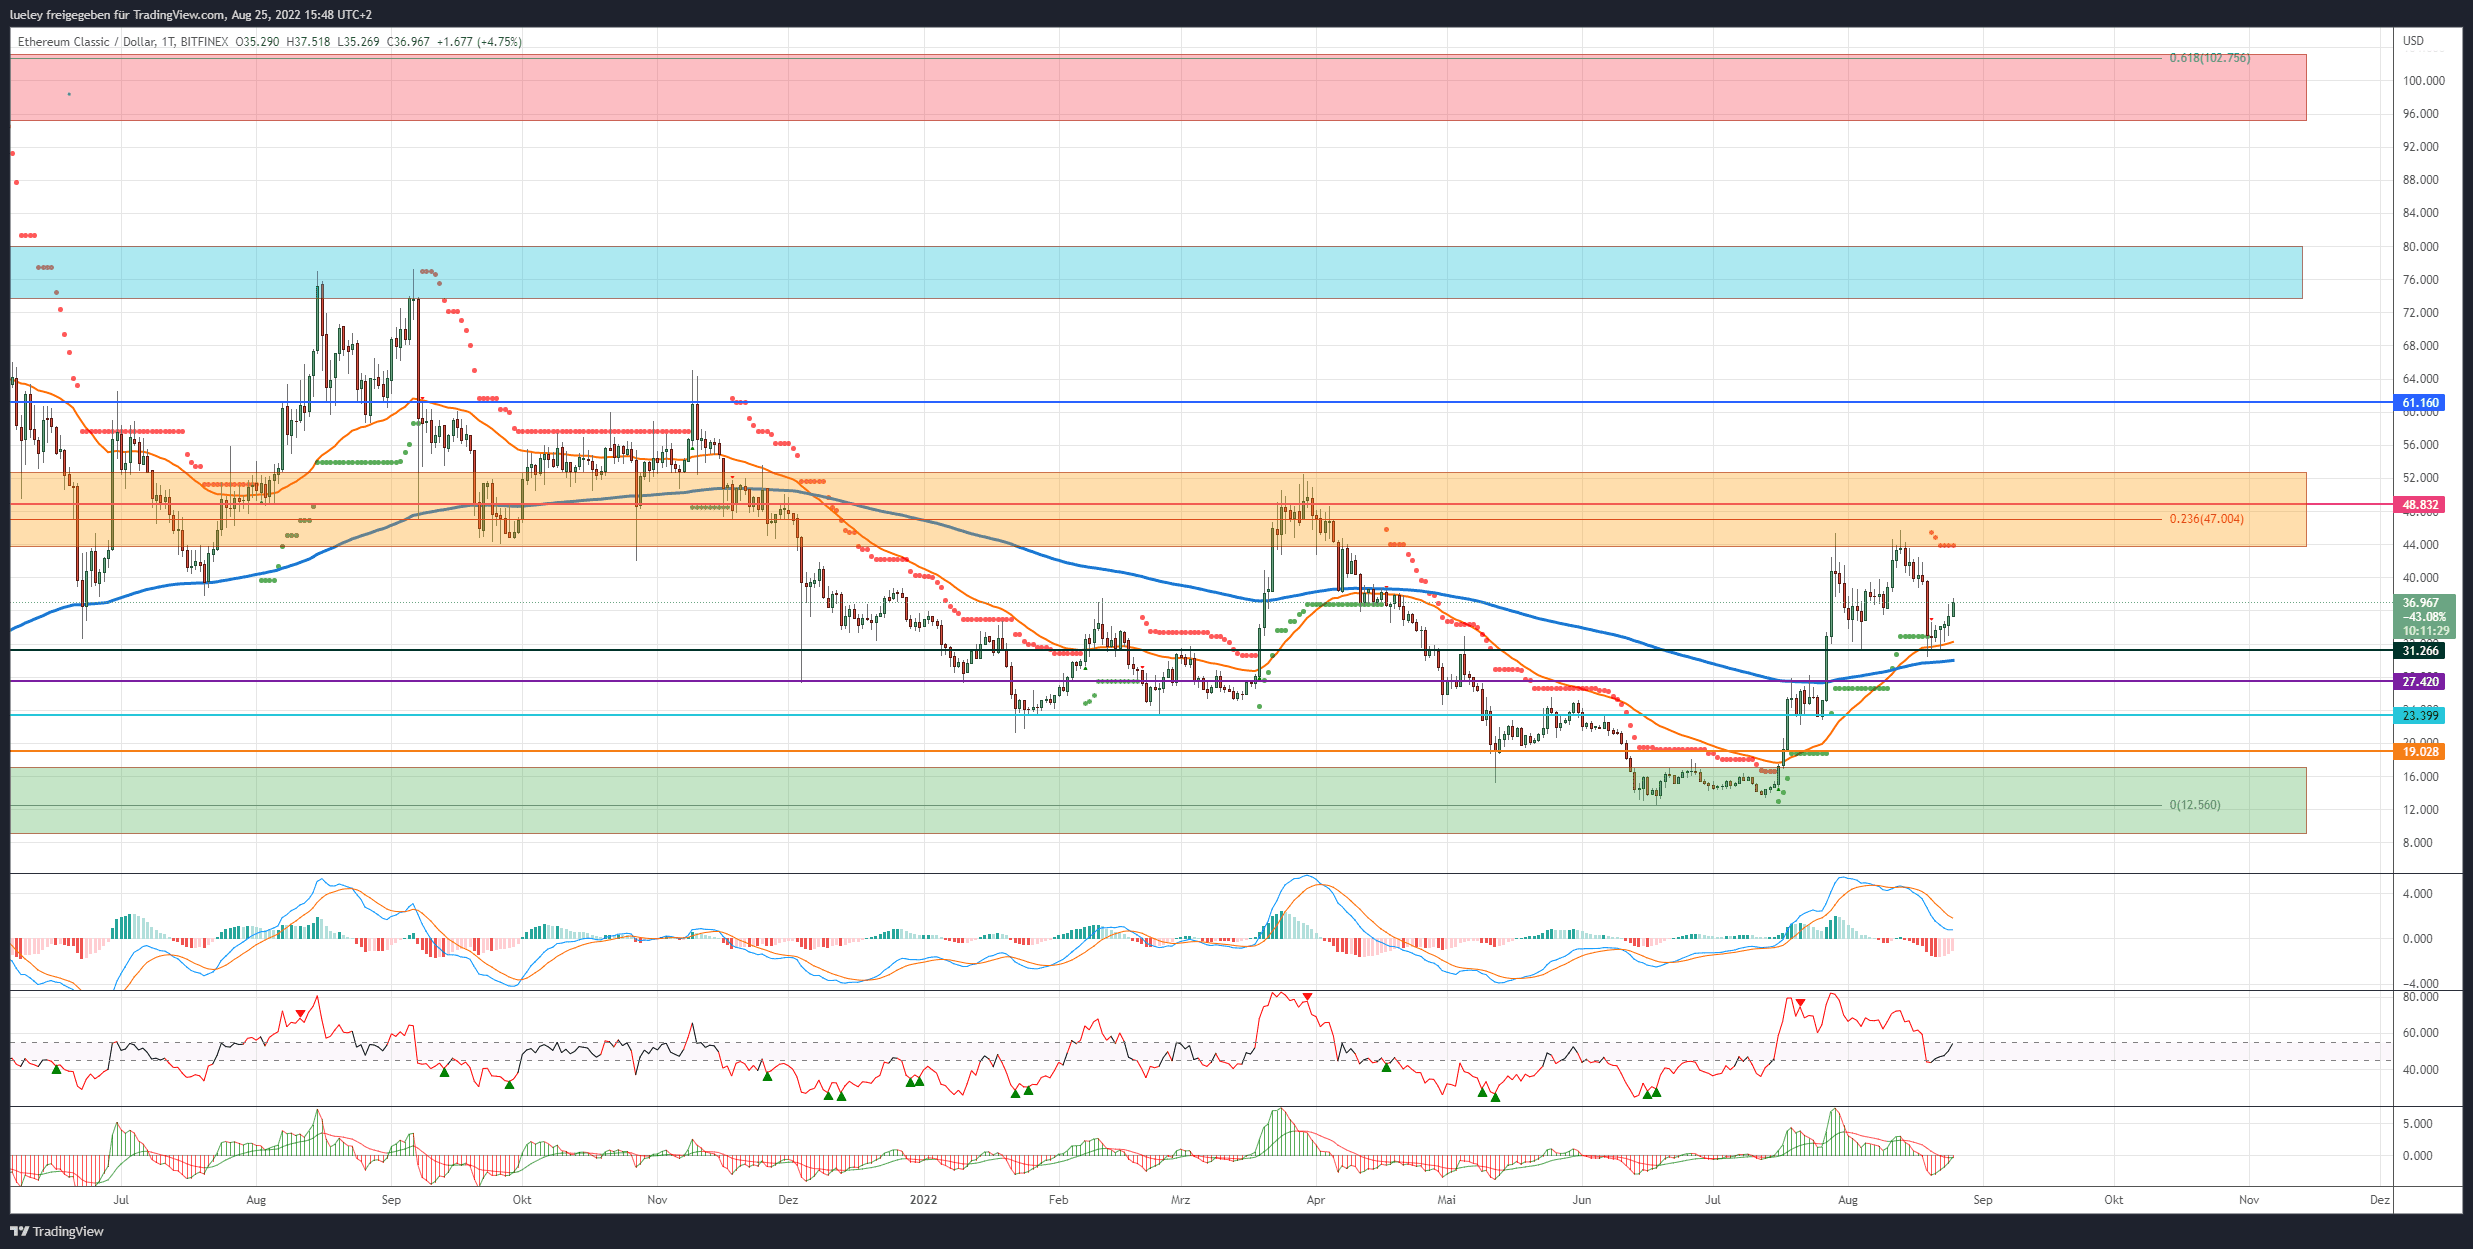
- Course (ETC): $36.96 (Previous week: $39.30)
- Short-term resistance/goals: $43.67, $47.00/$48.83, $52.76, $61.16, $73.74, $80.40, $95.25, $102.75
- Short-term support: $31.26, $27.42, $23.39, $17.10, $12.56
 Price analysis based on the value pair ETC/USD on Bitfinex
ETC Recap:
- Regardless of many investors who are looking exclusively at the hype around the merger of Ethereum (ETH) on Ethereum 2.0, the price of Ethereum Classic was able to triple in the slipstream of its big brother.
- Thus, the ETC price was able to significantly outperform the recent price rally of the Ether price.
- The ETC price rose by 260 percentage points from the low in July at around $ 13 in the peak in the direction of the higher-level 23 Fibonacci retracement at $ 47.04. The historical high reached $ 45.91 before more profit-taking began.
- The ETC price consolidated back to the cross support of EMA50 (orange), EMA200 (blue) and horizontal support at $ 31.26 in the following days.
- Here, Ethereum Classic has stabilized in the last few trading days and is currently rising north again.
- Although the proof-of-work based blockchain has not been further developed for a long time, the largest Ethereum mining pool offers Ethermine.org offer its users a switch to the Ethereum Classic Mining pool after switching off their own Ethereum node.
- Whether the mining of Ethereum Classic will be cost-covering for the mining operators in the long term is currently difficult to say, since the ETC price is significantly below the Ether price.
- From a chart technical point of view, however, investors can use the hype around the merge to their advantage at least until mid-September and thus benefit from a possible price increase at Ethereum Classic.
Bullish scenario (ETC):
- After a price stabilization in the area of $ 31.26 in the last trading days, Ethereum Classic is heading north together with Ethereum on Thursday.
- If the investors manage to lift the ETC price again in the direction of the monthly high at $ 45.77, there is a first showdown between bulls and bears.
- If the resistance between $ 47.00 and $ 48.83 can then be overcome, the focus will first be on the historical high from March 2022 at $ 52.76.
- If there are no sustainable profit taking here and the ETC price subsequently asserts itself above the 23 Fibonacci retracement, the next price target at $ 61.16 is activated when breaking out of the orange zone.
- If this price mark is also overcome by the daily closing price, a subsequent increase to the turquoise resistance range between $ 73.74 and $ 80.40 is conceivable.
- Once again, it is necessary to plan in this zone with increased sales by the bull camp.
- If, contrary to expectations, this area can also be breached, even a break through to the red resistance range between USD 95.25 and USD 102.75 is not excluded, subject to a crypto market that is also rising.
- The price mark of 102.75 USD represents the maximum price target for Ethereum Classic from a current point of view. This is where the 61 Fibonacci retracement of the overarching trend movement takes place.
- However, reaching this price level beyond the $ 100 mark is unlikely, given the low relevance of the ETC blockchain.
- As long as the ETC price is quoted above the EMA200 in the daily chart, investors can try to use temporary price resets for a long entry.
Bearish Scenario (ETC):
- The bears pushed the ETC price back to the strong support in the area of $ 31, but here the seller side left the strength for another sell-off.
- The seller camp should now try to cap the ETC price at the latest in the orange resistance zone and in turn initiate a new sell-off.
- A first success would be seen in the sell-off up to the support at $ 27.42.
- If this support does not stop, the correction immediately expands towards $ 23.39.
- At this support mark, a backlash from the buyer side is to be expected. This price level represents the breakout level of the recent upward rally.
- If Ethereum Classic breaks dynamically below this support at the close of the day, the downward movement widens to the 19.02 USD.
- However, a retest of the support level at $ 17.10 is more likely.
- If the bulls remain on the sidelines here as well and do not invest again in the crypto original rock, the chart picture will finally cloud over.
- Then the ETC course should disappear into insignificance again.
- A sell-off towards the annual lows at $ 12.56 would be increasingly likely.
Disclaimer: The price estimates presented on this page do not constitute buy or sell recommendations. They are just an analyst’s assessment.
The chart images were created using TradingView.
USD/EUR rate at the time of writing: 1.00 Euro.


