The TRON price is on the threshold of breaking out bullish. Can the TRON price now rise to $ 0.13 or will it be rejected bearishly?
TRON price is at trend line resistance
 TRON Price Chart by Tradingview
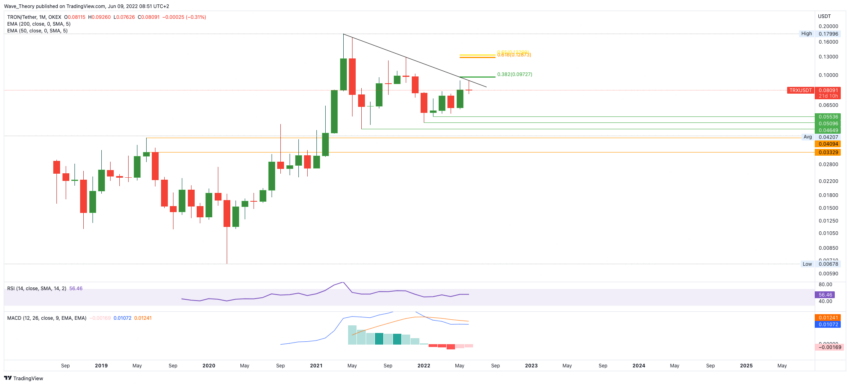
In the monthly chart, the MACD’s histogram ticks bullish higher, but the MACD lines remain bearishly crossed. With the sharp increase last month, TRON followed the upward movement this month and reached a trend line resistance, which extends over the period from the beginning of 2021 to today.
So far, TRON is encountering bearish rejection at the trendline. Should TRON still break the resistance, the 0.382 Fib resistance is already only 5% higher at around $ 0.097.
On the weekly chart, the MACD is bullish
 TRON Price Chart by Tradingview
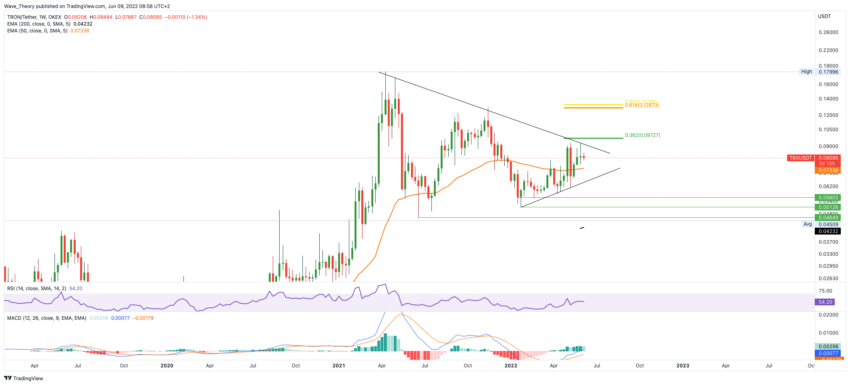
Also in the weekly chart, the histogram has been ticking bullish higher for the last few weeks, but it has been ticking bearishly lower so far this week. Nevertheless, the MACD lines remain bullish crossed and the RSI gives neither bullish nor bearish signals, but a bearish divergence could begin.
If the TRON price starts a correction now, it will find significant support between $ 0.051 – $ 0.056.
If this support is broken bearishly, support is still waiting for the TRON price at around $ 0.046 before it goes one floor lower.
A Golden crossover established itself in the daily chart
 TRON Price Chart by Tradingview
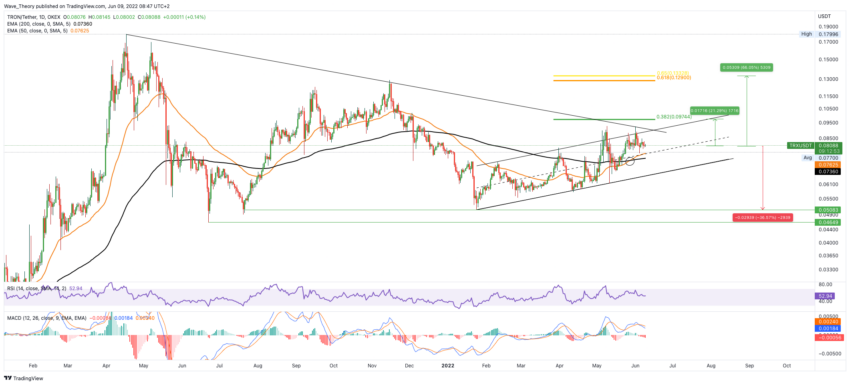
In the daily chart, the MACD is clearly bearish, because the histogram ticks bearishly lower while the MACD lines remain bearishly crossed. In addition, the TRON price has now reached the local high point at around $ 0.093 for the second time, which indicates a bearish divergence in the RSI of the daily chart.
Although TRON is in a parallel upward channel, TRON could now fall to the lower end of the channel in terms of bearish divergence, at around $ 0.066, or even to the next horizontal support between $ 0.046 – 0.05. This implies a downside potential of around 36%.
TRON price struggles with 50-month EMA in the BTC chart
 TRON Price Chart by Tradingview
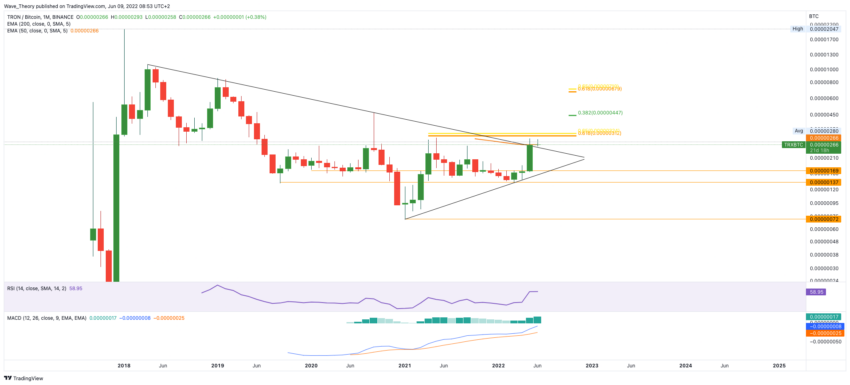
The TRON price is also struggling against BTC with the trend line resistance, which has existed here since 2018. In addition, the 50-month EMA is there, at just under 0.00000266 BTC, which acts as an additional resistance.
In addition, significant Fibonacci resistance is only slightly above this, at around 0.0000032 BTC.
If TRON breaks these resistances, it could rise to the next Fib level at around 0.0000045 BTC. Otherwise, it will only find support again between 0.0000014 – 0.0000017 BTC.
Overall, however, the TRON price in the BTC chart is very bullish, because the histogram ticks bullish higher and the MACD lines are crossed bullish. If TRON breaks the resistance between 0.0000027 – 0.0000032 BTC now, TRON could break out bullish. Because this would break the bearish trend line, which has established itself through a series of lower high points.
If TRON establishes a high point above the recent high points at around 0.000003 BTC and 0.0000047 BTC, it would be a strong indication of a bullish trend change. So far, the TRON price is still just below the last high point at around 0.000003 BTC.
Disclaimer
All information contained on our website is researched to the best of our knowledge and belief. The journalistic articles are for general information purposes only. Any action taken by the reader on the basis of the information found on our website is done exclusively at his own risk.
