How the AWS Toolkit helps with Troubleshooting Cloud debugging for Containers on Amazon ECS
Containerized cloud applications are not free from errors. But how can containers actually be debugged without having to replicate complex cloud architectures on a local computer?
Companies on the topic
 Debugging session for an Amazon ECS container in the PyCharm IDE.
(Image: JetBrains / AWS)
Containers give developers the ability to bundle the code, configurations and dependencies of an application into one object. In addition, containerized applications are usually small, portable and can be run on a variety of environments to make applications easy to operate and scale.
Customers use containers for many use cases, such as microservices, batch tasks, machine learning or to migrate existing applications to the cloud. To administer and orchestrate a large number of (docker)containers, container management systems exist such as Kubernetes and Amazon Elastic Container Service (Amazon ECS).
If an error occurs in a container, these orchestration tools usually only help to a limited extent with integrated logs and metrics. Local debugging of the container is possible, but often complex environments have to be emulated. This means additional effort for developers and potentially brings new sources of error.
In order to simplify the debugging of containers running on Amazon ECS in the AWS Cloud, cloud debugging (beta) for the AWS Toolkit for JetBrains was introduced at the end of 2019. This feature allows you to debug containers running on Amazon ECS in the well-known JetBrains IDEs (IntelliJ, PyCharm, WebStorm, etc.).
Debugging with the AWS Tookit in PyCharm
 Debugging with the AWS Toolkit in PyCharm.
(Picture: AWS)
To debug a containerized application with the AWS Toolkit, it must run on Amazon ECS and the associated image must be hosted on Docker Hub or Amazon ECS. The AWS toolkit must be installed and configured for the respective IDE. The necessary steps are described in the AWS documentation. The preceding figure shows what changes the AWS Toolkit makes in the ECS cluster when the cloud debugging feature is enabled.
In this example, a RESTful API is run on ECS. The endpoint to which the user sends the request is an Application Load Balancer (ALB). This distributes incoming traffic to one or more containers that are registered in a target group (also called Target Group), in addition, the ALB monitors the status of destinations and sends traffic only to destinations that pass the defined healthcheck.
Normally, the Unicorn API Service (marked with number 1) will answer this request. When cloud debugging is enabled, AWS Toolkit automatically creates an identical ECS service with the prefix “cloud debug” (marked with number 2). The Load Balancer target group configuration is adjusted so that traffic is routed to the newly created ECS service.
This offers the advantage that the original container and service are not changed. The changed forwarding to the new target group is not visible to users, but changing the target group leads to short interruptions in the availability of the service. Therefore, this Feature should not be used in productive environments.
The newly created service executes a Sidecar container in addition to the regular container. To this end, Cloud Debug has created a new version of the ECS Task Definition and added the Sidecar Container, which executes a Docker image provided by AWS. The additional container is needed to enable some features of cloud debugging.
Installation of the necessary components
To enable cloud debugging for your Amazon ECS service, follow these steps:
1. Installation of the AWS Toolkit
The toolkit is available for multiple IDEs of JetBrains. A step-by-step guide can be found in the AWS documentation.
2. Cloud debugging enable
To enable cloud debugging must be selected in the AWS Explorer within the IDEs Amazon ECS with the debug Cluster and Service. The “Enable Cloud Debugging” function can be selected via the context menu. This process can take a few minutes, then the build output of the IDEs will show the successful activation. An IAM role must be selected, this should be the default ECSTask role, to which the AWS Managed Policy “AmazonSSMManagedInstanceCore” has been added.
3. Customize Debug configuration
To configure the Cloud Debugger, the” Edit Debug Configuration ” window in the IDE is opened (usually found under “Run”). AWS ECS Service Cloud Debug (Beta) should be preselected and allow the selection of the ECS cluster and services. “Start Command” specifies the command with which the application can be started (for example python /src/app.py). The Artifacts Mapping area specifies which local directory contains the application code. This path is used for code synchronization.
4. Start Debug Session
Now the debug session can be started as usual via the IDE with the previously created configuration.
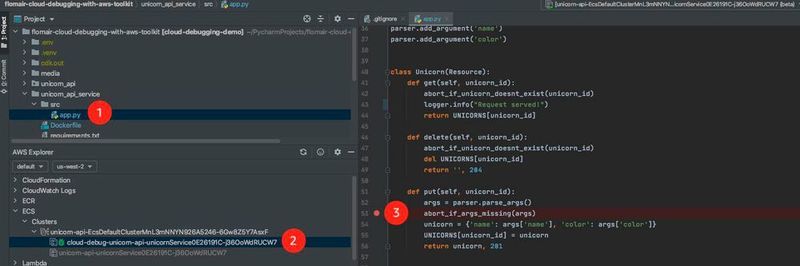
 Local application copy, (2) AWS Explorer, (3) Breakpoint, (4) Variables in Breakpoint, (5) Debugging Logs, (6) Remote CLI") (1) Local application copy, (2) AWS Explorer, (3) Breakpoint, (4) Variables in Breakpoint, (5) Debugging Logs, (6) Remote CLI
(1) Local application copy, (2) AWS Explorer, (3) Breakpoint, (4) Variables in Breakpoint, (5) Debugging Logs, (6) Remote CLI
(Image: JetBrains / AWS)
This figure gives an overview of the cloud debugging features in PyCharm. In the AWS Explorer, it is possible to start a command line within the container with the context menu command “Start Remote Shell” when selecting the corresponding ECS service. The following is a detailed explanation of the debugging window.
(1) Local copy of the application: Code changes can be made here, which are then synchronized into the container by restarting the stop and start
(2) AWS Explorer: Enables and disables the cloud debugging functions (debugging, log streaming, command line in container)
(3) Breakpoint in the local copy of the application: Breakpoints in the local code can be used without the restart of the debugger.
(4) variables in the Breakpoint: To debug the application, the variables can be inspected at the set breakpoint.
(5) Debugger Console Logs: This console outputs the logs from the debugger. Alternatively, logs can also be loaded via the LogStreaming feature of CloudWatch.
(6) Remote command line: This feature allows to execute commands inside the container. This can be htop, for example, to monitor ongoing processes and their resource consumption.
Conclusion

Florian Mair (Picture: AWS)
Using the AWS Toolkit for JetBrains enables debugging of ECS-based containers without having to run them resource-intensive locally. Particularly helpful are functions such as code synchronization between local environment and container, the remote shell (for starting a command line in the respective container) or the direct retrieval of CloudWatch logs directly in the IDE. An example of application to Use cloud debugging with the AWS Toolkit can also be found at GitHub.
* Florian Mair works as a Solutions Architect at Amazon Web Services. In doing so, he accompanies software companies on their way to the cloud and supports them in modernising their applications into SaaS, i.e. software-as-a-service products.
(ID:47300592)