In this article, we’ll look at the Mayer Multiple Indicator (MM) and its components to see if the longer-term price outlook for Bitcoin is bullish or bearish.
Bitcoin and the 200-Day Moving Average
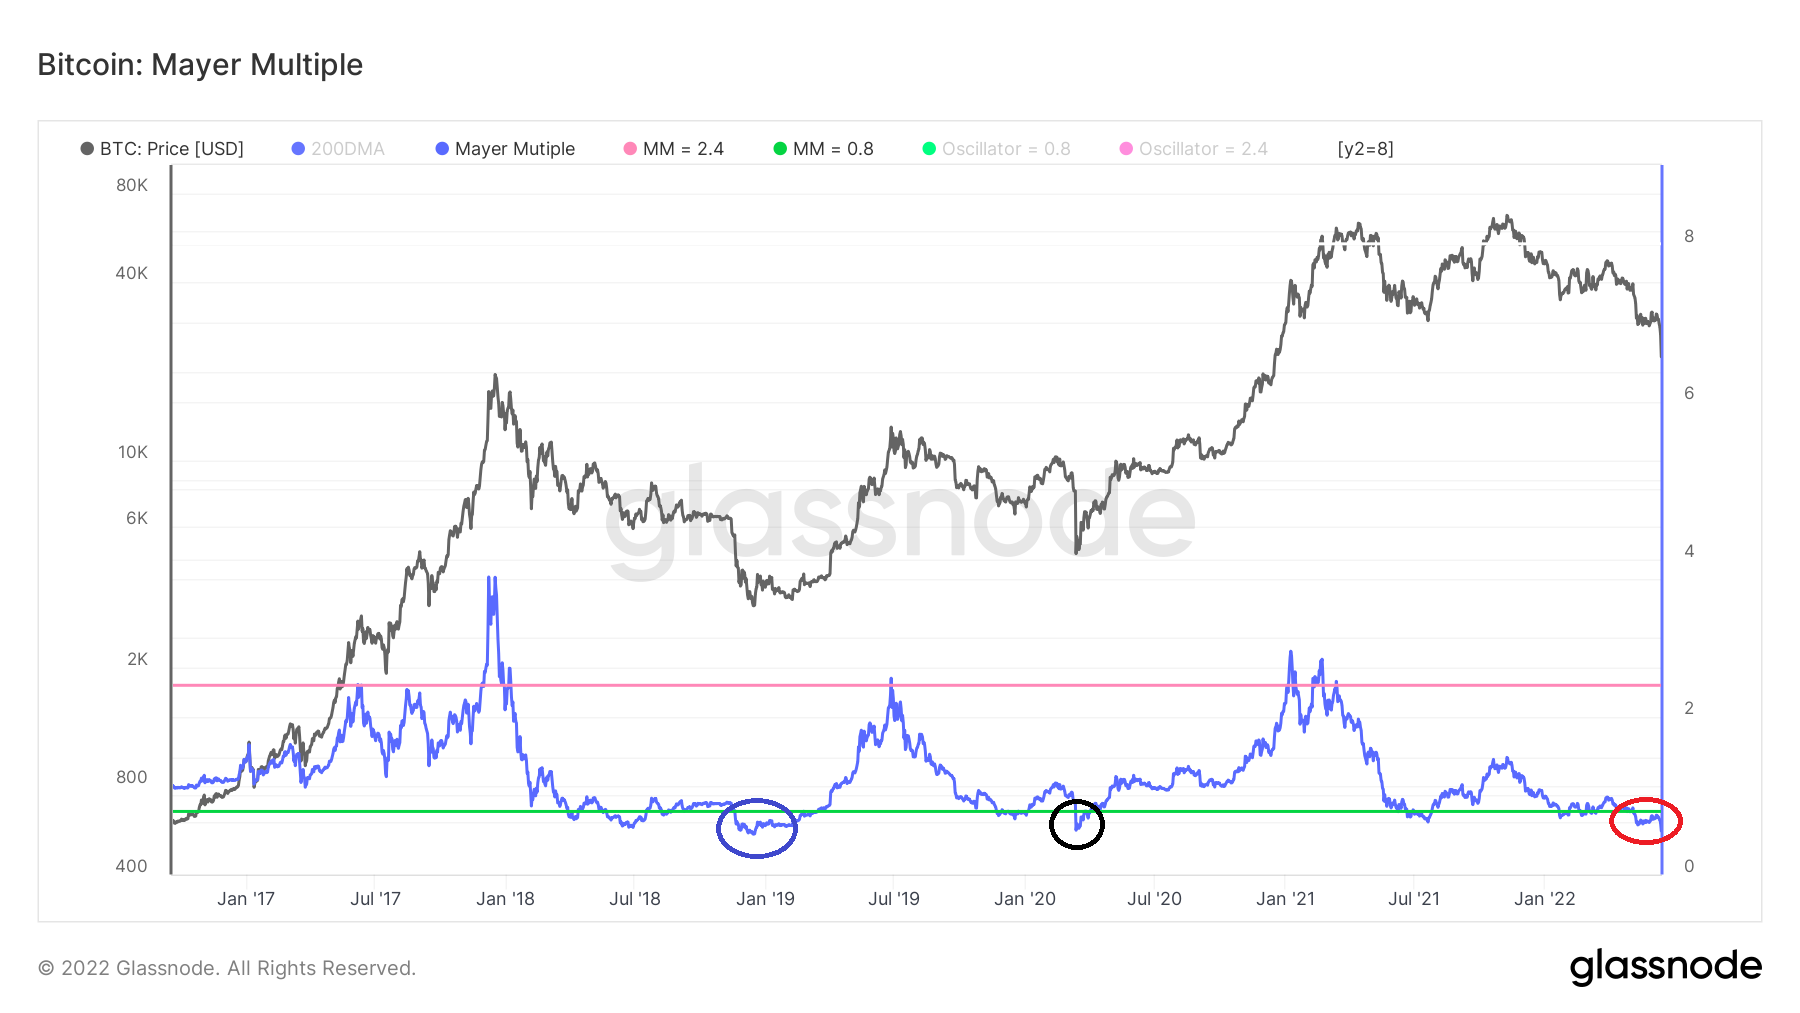
In the chart below you can see the Bitcoin price (black) together with the 200-day moving average (the moving average value of the last 200 days). The 200-day MA is an indicator of the Bitcoin trend. The trend can be considered bullish when the BTC price is trading above the moving average and bearish when the Bitcoin price is below it.
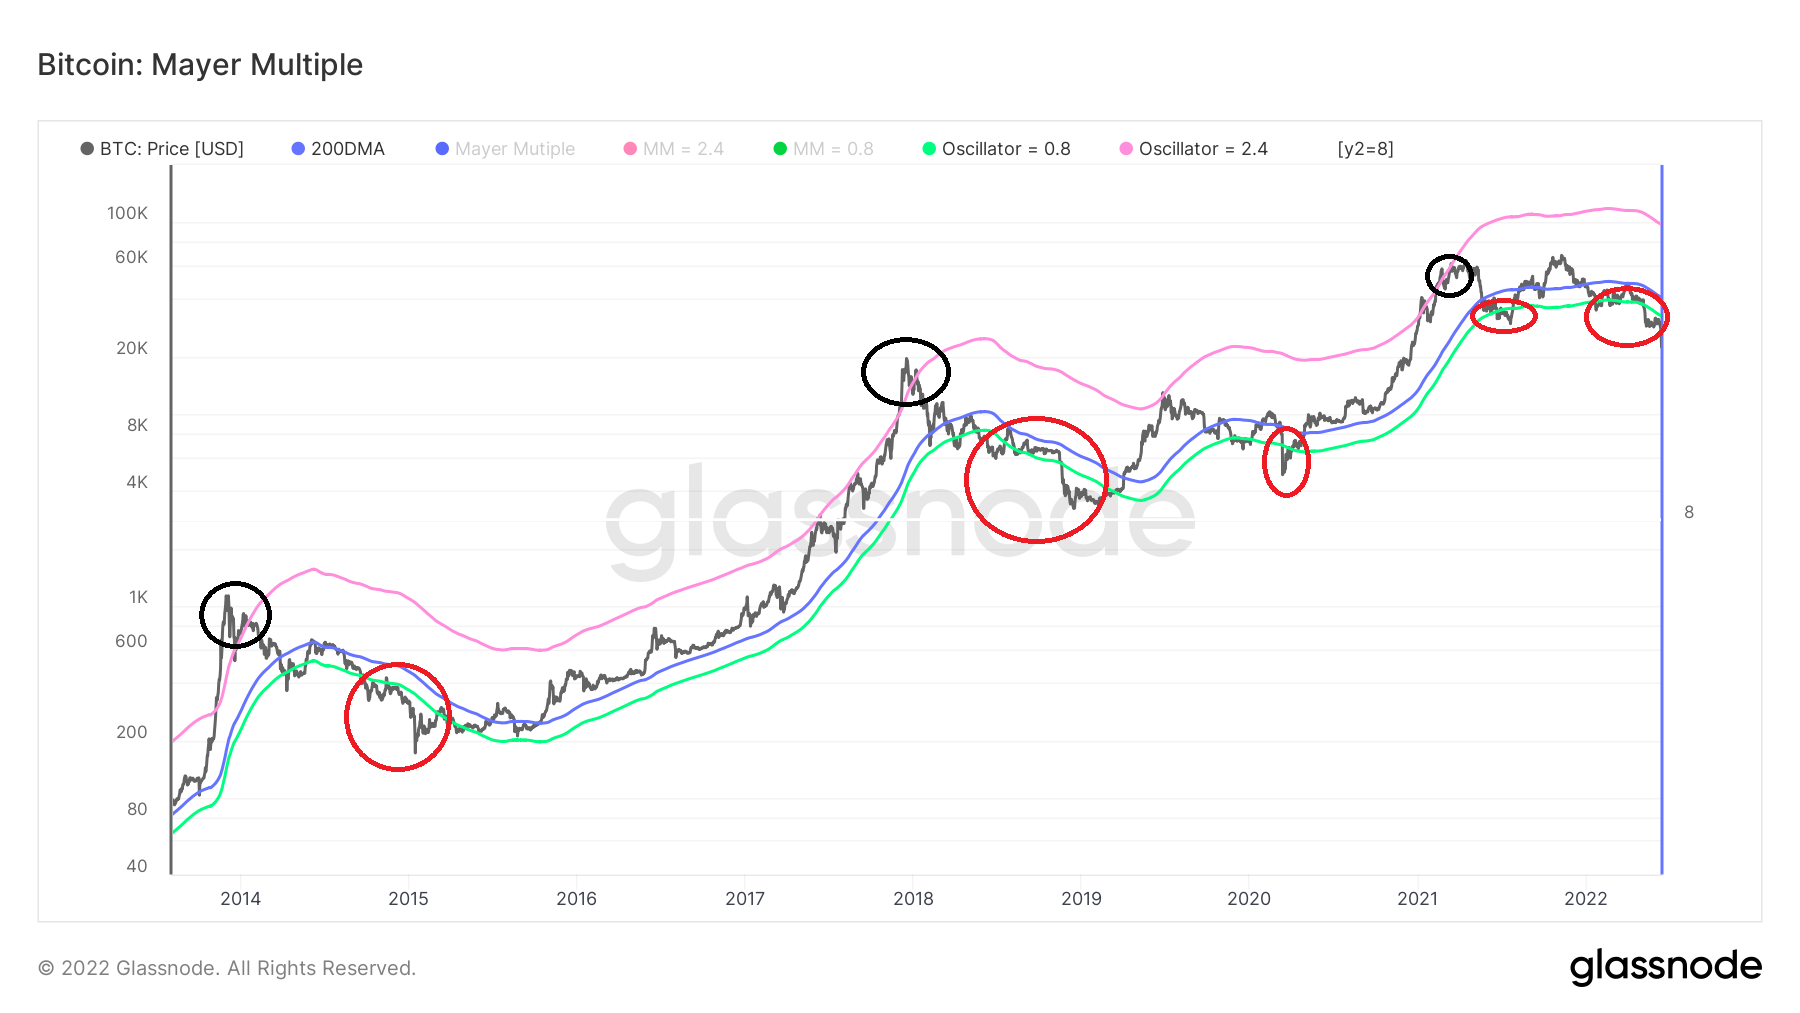
In addition, the 0.8 oscillator (green) and the 2.4 oscillator (purple) of the 200-day MA were added to the chart. With these two oscillators, the macro bottoms and tops could be determined relatively well.
In the past, the highs of a market cycle could have been predicted fairly accurately with the 2.4 oscillator. The Bitcoin price reached the last three price peaks (black circles) not long after the price rose above the oscillator.
The Bitcoin price formed all the macro bottoms (red circles) when it was below the 0.8 oscillator. However, one could have predicted the bottoms much more imprecisely with this indicator, since it took comparatively longer for the BTC price to really form the bottom.
The BTC price last fell below the 200-day MA in July 2021 and in January 2022. In June 2022, this then erupted significantly below the MA. Currently, the Bitcoin price is currently well below the MA.
 Source: Glassnode
Mayer Multiple Indicator (MM)
The Mayer Multiple (MM) is an oscillator in which the Bitcoin price is divided by the associated 200-day moving average.
The Mayer Multiple indicator (blue) then uses the difference between the Bitcoin price and its 200-day MA. In addition, the 0.8 oscillator (green) and the 2.4 oscillator (purple) are plotted to determine the macro bottoms and peaks.
This method is much more accurate than simply using the raw price data. Especially when it comes to determining the macro bottoms and tops.
In one of our previous analyses, we wrote: a “capitulation event similar to that from November to December 2018” could occur. This was written due to the movement above and below the 0.8MM oscillator.
Now the MM reached 0.55 (red circle). This value is slightly lower than the value of March 2020 (the Covid crash, black circle) and approximately at the level of the value of December 2018. With these data, the Bitcoin price reached the last macro bottom.
If history repeats itself, then the Bitcoin price could soon reach the next bottom or have already reached it.