The Bitcoin price has now fallen to around 17,600 USD and is thus entering the support zone between 14,000 – 20,000 USD. Is the ground reached now?
Bitcoin price falls to around 17,600 USD
 Bitcoin Price Chart by Tradingview
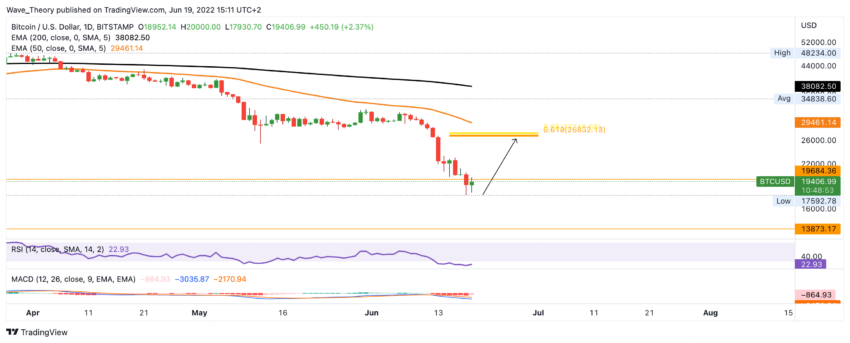
The Bitcoin price fell below the $ 20,000 mark yesterday and established a new low at around $ 17,600. Thus, the BTC price penetrates deeper into the support zone between 14,000 – 20,000 USD.
Meanwhile, the RSI is reaching oversold regions and the histogram is already ticking bullish higher today. Apart from that, however, the indicators are clearly bearish: the MACD lines remain bearishly crossed and the death cross of the EMAs also remains intact, which means that the trend remains bearishly confirmed in the short to medium term.
Should Bitcoin bounce off and climb upwards, significant Fibonacci resistance at the Golden Ratio is waiting for the BTC price at around $ 27,000.
Bullish divergence in the 4H chart fuels the upward movement
 Bitcoin Price Chart by Tradingview
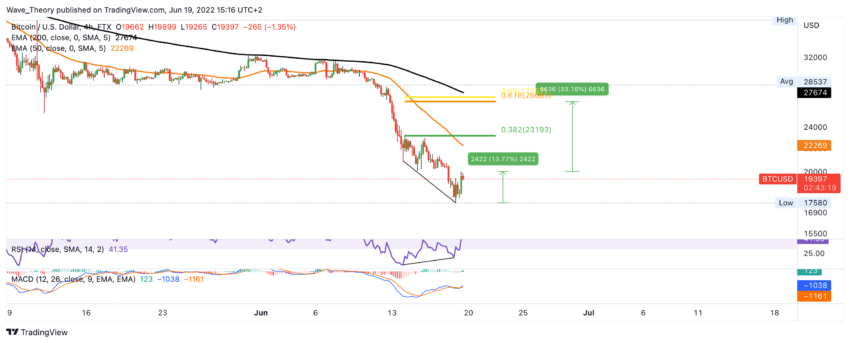
In the 4H chart, a bullish divergence is emerging in the RSI and histogram of the MACD. As a result, the BTC price could already rise about 14% and Bitcoin could now rise another 33% to meet rejection at the golden Ratio at around $ 27,000.
However, the Bitcoin price is already finding significant Fibonacci resistance at around $ 23,200. In addition, the 50-4H and 200-4H EMAs are close to the Fibonacci resistances, at around $ 22,300 and $ 27,700.
Weekly chart shows no trend reversal yet
 Bitcoin Price Chart by Tradingview
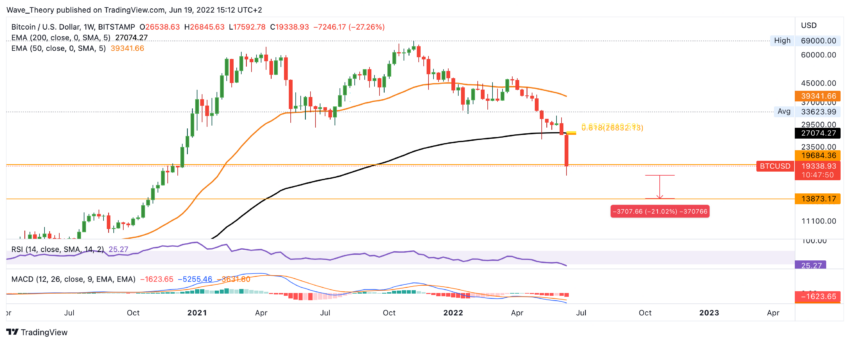
However, there are still no signs of a bullish trend reversal on the weekly chart. For example, the RSI is now reaching oversold regions, but it is not giving bullish or bearish signals. In addition, the histogram of the MACD continues to tick bearishly lower and the MACD lines remain bearishly crossed.
In fact, the Bitcoin price could still fall about 21% lower than the last low at around $ 17,600 to correct to around $ 14,000. If Bitcoin should nevertheless rise in the short term, the 200-week EMA is also waiting for the BTC price at the golden Ratio at around 27,000 USD, which also acts as resistance.
Could the Bitcoin price fall again to around $ 3,800?
 Bitcoin Price Chart by Tradingview
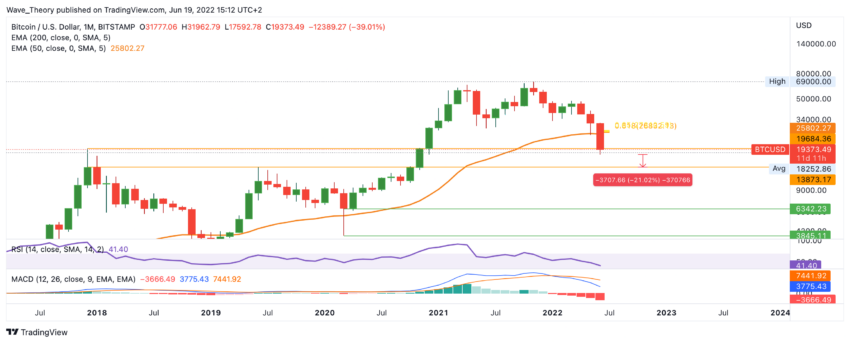
If the Bitcoin price breaks the support between 14,000 – 20,000 USD bearishly, Bitcoin could actually return to the annual low of 2020. Because then only between 3.800 – 6.400 USD significant support is waiting for the BTC price again.
Crypto Market Capitalization Reaches Support at $766 Billion
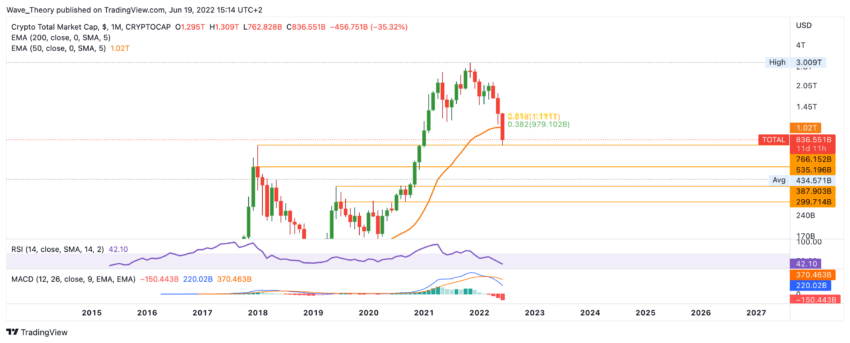 Crypto Market Capitalization Chart by Tradingview
The crypto market capitalization has now reached the upper limit of the support zone between 530 – 770 billion USD. Thus, the crypto market capitalization is now back at the level that the crypto market reached in 2018.
Nevertheless, the crypto market now seems to be bouncing off the support at $766 billion. At around USD 980 billion and USD 1.1 trillion, the next significant Fibonacci resistances are waiting for the crypto market.
Disclaimer
All information contained on our website is researched to the best of our knowledge and belief. The journalistic articles are for general information purposes only. Any action taken by the reader on the basis of the information found on our website is done exclusively at his own risk.


