The XRP price is currently at a golden Ratio resistance, which intersects with the 50-day EMA. Can Ripple break out bullish?
The XRP price is currently struggling with the 50-day EMA
 XRP Price Chart from Tradingview
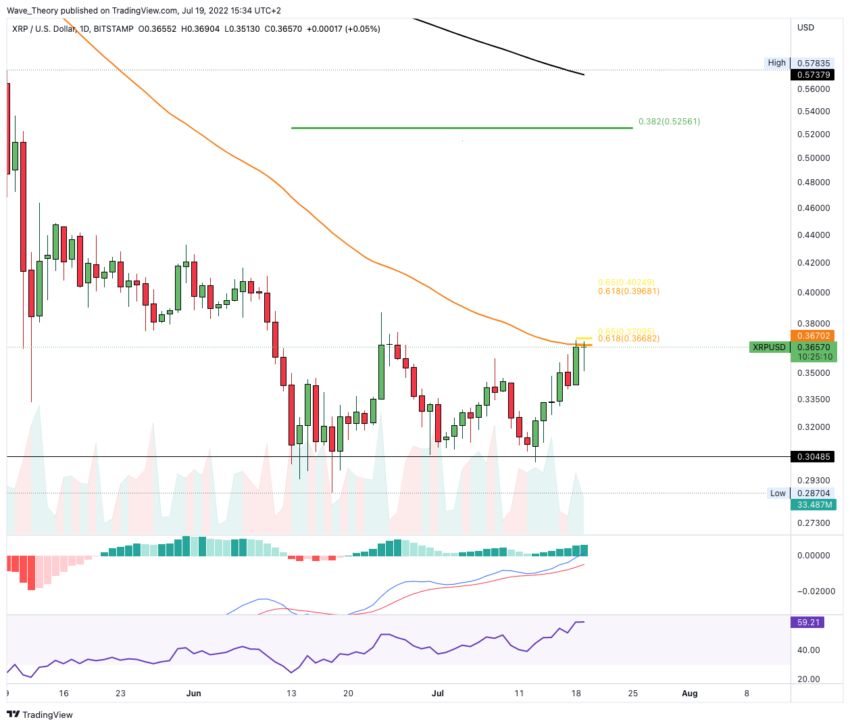
Currently, the XRP price is struggling with the 50-day EMA at around $ 0.367, where there is additional Golden Ratio resistance. Should Ripple overcome this resistance, it could rise to the next golden ratio at around $0.4. However, if XRP is now rejected bearishly, Ripple will find the next significant Fibonacci supports at around $0.344 and $0.326.
In the daily chart, however, the Ripple price is very bullish, because the histogram of the MACD is gradually ticking bullish higher and the MACD lines are crossed bullish, while the RSI is neutral.
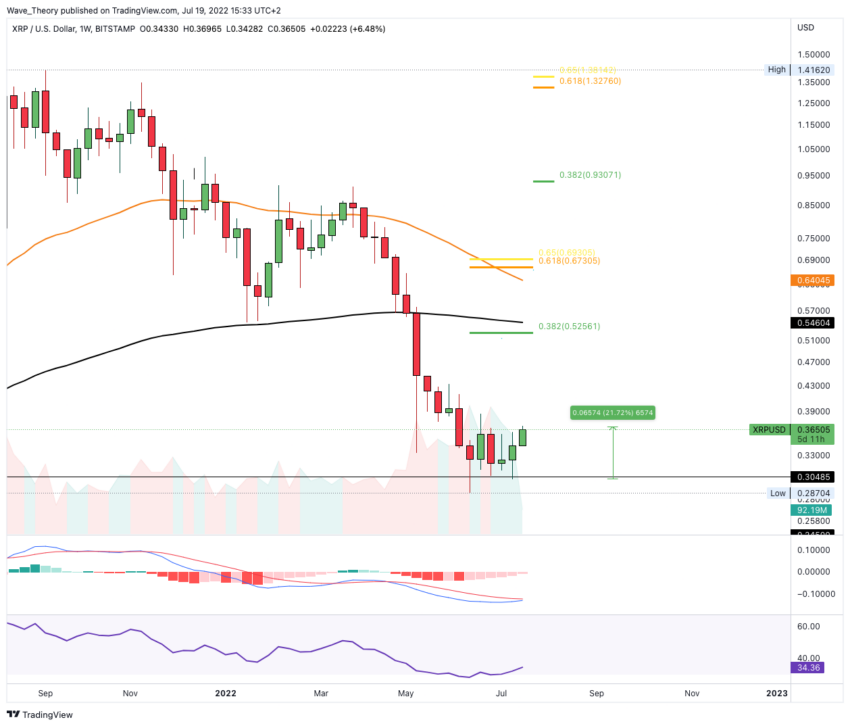
In the last two weeks, the Ripple price has already been able to rise by about 22%
 XRP Price Chart from Tradingview
The Ripple price has already been able to rise around 22% in the last two weeks and currently it looks as if the support could hold at around $ 0.3. Then the low point at $0.287 could actually mark the bottom. After all, the MACD’s histogram has been ticking bullish higher for several weeks now and the MACD lines are now on the verge of a bullish crossover.
The XRP price will find the next significant Fibonacci resistances at around $ 0.53 and $ 0.68, provided that the Ripple price can break the Golden Ratio bullish at around $ 0.4.
XRP price could rise to $0.93 in the medium term
 XRP Price Chart from Tradingview
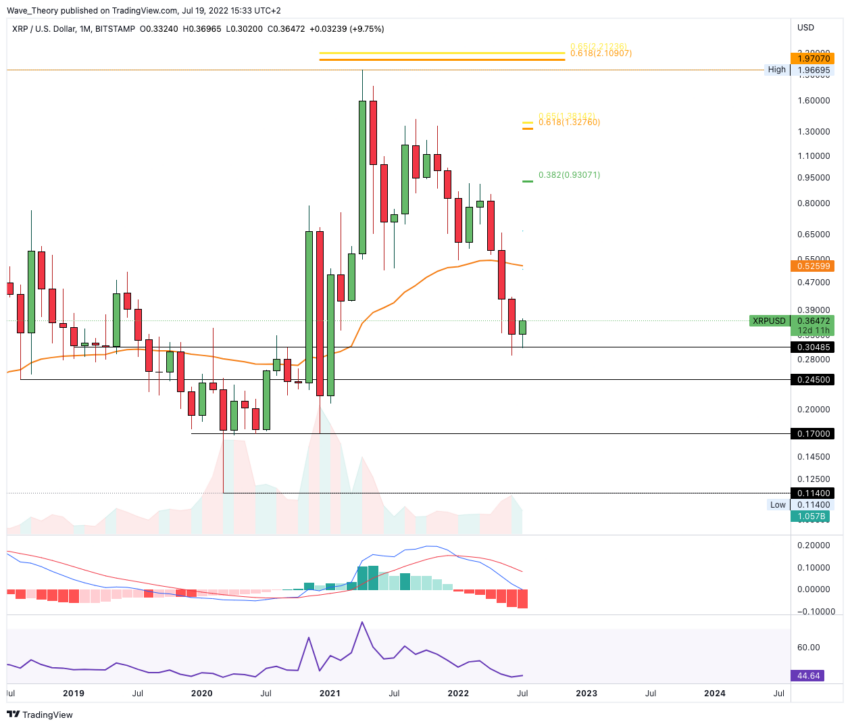
If the support can successfully hold between $ 0.245 and $ 0.3, the medium-term price target is around $ 0.93. There, the XRP price hits the 0.382 Fib level. A little higher, at around $ 1.35, then significant resistance is waiting for Ripple at the Golden ratio.
However, the trend remains bearish, unless Ripple breaks the golden Ratio bullish at around $ 2.1. Because Ripple has been in a bear trend since 2018.
In addition, the histogram of the MACD in the monthly chart is still ticking bearishly lower and the MACD lines are also crossed bearishly, while the RSI is neutral.
Against BTC, the XRP price was bearishly rejected at Golden Ratio resistance
 XRP Price Chart from Tradingview
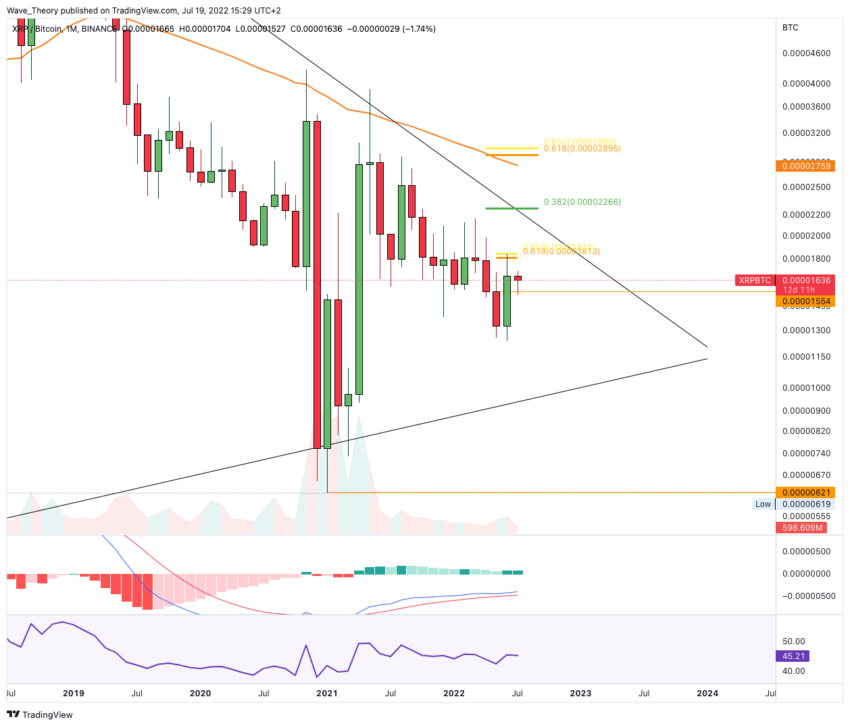
Against BTC, the MACD is much more bullish on the monthly chart, because the MACD lines are crossed bullish and the histogram has been ticking bullish higher since last month. The RSI is also neutral here.
Last month, the Ripple price at the Golden Ratio at around 0.000018 BTC was bearishly rejected, which must be broken if XRP wants to rise to the 0.382 Fib level at around 0.0000226 BTC. Without the break of the 0.382 Fib level at around 0.0000226 BTC, Ripple cannot break out of the symmetrical triangle bullish. The next resistance is then waiting between the 50-month EMA at around 0.0000276 BTC and the Golden Ratio at around 0.000029 BTC.
Disclaimer
All information contained on our website is researched to the best of our knowledge and belief. The journalistic articles are for general information purposes only. Any action taken by the reader on the basis of the information found on our website is done exclusively at his own risk.


